1 Introduction Http://
   The vortex flowmeter (or vortex flowmeter ) is a new type of velocity flowmeter based on the principle of fluid oscillation. Its output signal is a pulse frequency signal or a standard current signal proportional to the flow rate, which can be transmitted over long distances, and the output signal is only related to the flow rate, and is not affected by the temperature, pressure, composition, viscosity and density of the fluid. The utility model has the advantages of wide measuring range, simple structure, no moving parts, and the detecting component does not contact the fluid to be tested, and has the characteristics of high measuring precision, wide application range and long service life. Therefore, since the birth of the vortex flowmeter in the late 1960s, the development has been extremely rapid. Many researchers have carried out a lot of work, developed many types of vortex flowmeters, and mass-produced them on the market. Flowmeters from laboratory prototypes to mass production processes in a few years are unique.
However, after the “vortex street heat†of the 1980s and 1990s, the development of vortex flowmeters slowed down. Due to the lack of experience in the production, design, selection and application of this new type of instrument, in the face of a wide variety of sites and measurement objects in various industries, some problems are gradually exposed, such as the impact of installation conditions and methods on measurement. Different instrument manufacturers will give a more reasonable recommended value for the installation conditions (ie the length of the straight pipe section required under various conditions of use). However, for installation (i.e., horizontal or vertical installation meter) due to the influence of the vortex flowmeter, generally it is not involved. In this paper, the effects of horizontal and vertical installation methods on the measurement of vortex flowmeters are quantitatively discussed and compared by experimental research under the same conditions.
2. Vortex flowmeter measurement principle
Inserting a non-streamlined columnar body (ie, a vortex generator) perpendicular to the flow direction in the fluid. When the flow rate is greater than a certain value, two rows of asymmetric vortex rows with opposite rotation directions appearing alternately on the two sides of the column (ie, Carmen vortex street), as shown in Fig. 1, by detecting the frequency generated by the vortex street, the flow rate of the fluid is obtained according to the relevant relationship. 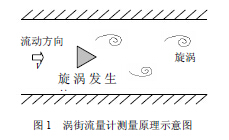
Let the frequency of occurrence of the vortex be f, the average velocity of the flow of the measured medium is u, the width of the vortex generator is d, and the inner diameter of the pipe is D. According to the principle of Karman vortex, the following relationship is obtained: 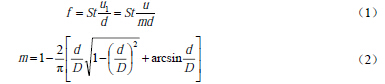
Where u1 is the average flow velocity on both sides of the vortex generator, m/s; St is the Strouhal number, and the dimension is 1; m is the ratio of the arcuate area on both sides of the vortex generator to the cross-sectional area of ​​the pipe, dimension Is 1.
The volumetric flow rate qv of the fluid in the pipeline is: 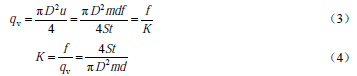
Where K is the meter factor of the vortex flowmeter, Hz/(m3/h).
Equation (3) is the basic relationship of vortex flowmeter measurement, in which K is related to the geometry of the vortex generator and the pipeline, and also related to the Strouhal number. The Strouhal number is a dimensionless parameter, which is related to the shape of the vortex generator and the Reynolds number. In the range of ReD = 2×10⁴ ~ 7×10⁶, St can be regarded as a constant, which is the normal working range of the instrument. At the same time, it can be seen that the pulse frequency signal output by the vortex flowmeter is not affected by the fluid properties and composition changes, that is, the meter factor is only related to the shape and size of the vortex generator and the pipeline within a certain Reynolds number range.
3. Installation method of vortex flowmeter
In practical engineering applications, vortex flowmeters usually have several installation methods as shown in Figure 2 [10], in which (a), (b), and (c) are all horizontal installations; (d) Vertical installation of the vortex flowmeter. Different installation methods should be used for different fluids. Ordinary liquids, gases, gases containing water, low-temperature gases and liquids, liquids and gases containing traces of solid particles, etc. can be installed by means of (a), (c), (d); high-temperature liquids, high-temperature gases, and steam can be used. (b), (c), (d) installation; wet saturated steam can be installed by (a), (c), (d); liquid-gas (containing trace gas), liquid-solid (containing trace solids) In the liquid-liquid two-flow, if the gas and solid phases do not exceed the measurable range, it is recommended to install it first (d). 
4. Experiment and result discussion
4.1 Experimental devices and processes
The structure of the experimental device is shown in Figure 3. The water regulator tank provides a constant water pressure for the pipeline, so that the flow rate is stable during the experiment. The water flow rate is regulated by the regulating valve, and the flow rate ranges from 2 to 20 m3/h. The electromagnetic flowmeter as a standard flow meter gives the standard flow rate of water entering the experimental section with an accuracy of 0.5%. The vortex flowmeters are installed in the experimental pipelines in both horizontal and vertical directions. They all have long enough lengths of the front and rear straight sections, and other installation conditions are strictly in accordance with the specified requirements. The signal of the vortex flowmeter is collected by an oscilloscope. The sampling frequency is 1000 Hz, and each set of data contains 2500 points. 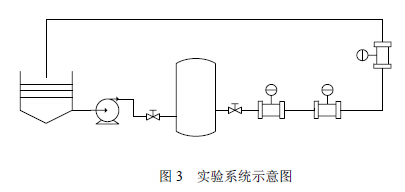
4. 2 Experimental results and analysis
The fast Fourier transform (FFT) is performed on the vortex signals measured in both the horizontal and vertical installation modes, and the vortex frequency value can be obtained. Figure 4 shows the relationship between the vortex frequency and the flow rate. As can be seen from the figure, the difference between the two is small. Then the zero-interval least squares fitting of the measured vortex rate and flow rate is respectively obtained, and the meter coefficients of the vortex flowmeter installed horizontally and vertically are 2.5202 Hz/(m3/h) and 2.5198 Hz/(m3/, respectively. h), the relative error is less than 0.02%. It can be seen that the installation method has little influence on the measurement of the vortex flowmeter and can be ignored. 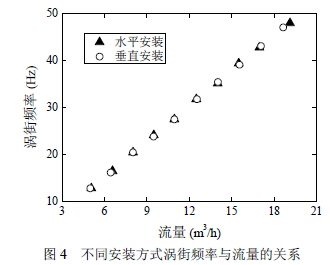
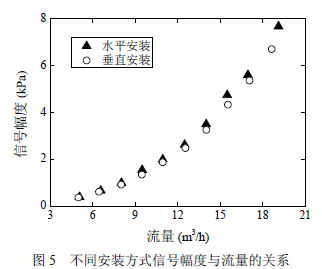
In order to further study the influence of the installation method of the vortex flowmeter, this paper also compares the amplitude of the vortex signal in both horizontal and vertical modes. Figure 5 shows the relationship between the amplitude and flow of the vortex signal. It can be seen that the signal amplitude is approximately quadratic with the flow. Under the same flow, the signal amplitude is basically equal, which shows the installation method of the vortex flowmeter. The effect on its signal amplitude is small, ie the energy of the vortex (proportional to the square of the amplitude) is almost unaffected. However, a closer comparison reveals that the amplitude of the signal when the vortex flowmeter is installed horizontally is slightly larger than that of the vertical installation. It can be qualitatively understood here that when the vortex flowmeter is installed vertically, part of the vortex energy is dissipated by overcoming the gravity, so that The vortex flow sensor sensed by the vortex flowmeter sensor is less, resulting in a reduction in signal amplitude.
Vortex Flowmeter http://